Distribution Curves
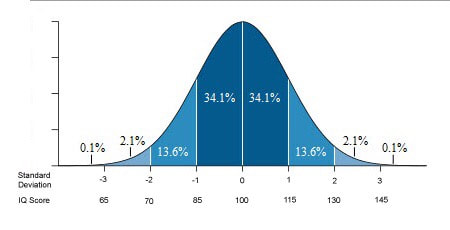
Variables such as height, weight, shoe size, exam results, and IQ scores – all tend to show normal distribution when plotted on graphs.
In Psychology, this information can help researchers make assumptions about the way in which populations are distributed.
Variables such as height, weight, shoe size, exam results, and IQ scores – all tend to show normal distribution when plotted on graphs.
In Psychology, this information can help researchers make assumptions about the way in which populations are distributed.
Normal Distribution Curves
|
= arrangement of data that is symmetrical and forms a bell-shaped pattern.
The mean, median and/or mode all are shown in the centre at the highest peak. 3 characteristics of normal distributions
|
|
|
Can you apply these 3 characteristics to a graph AND then say what this says about the population / sample?
|
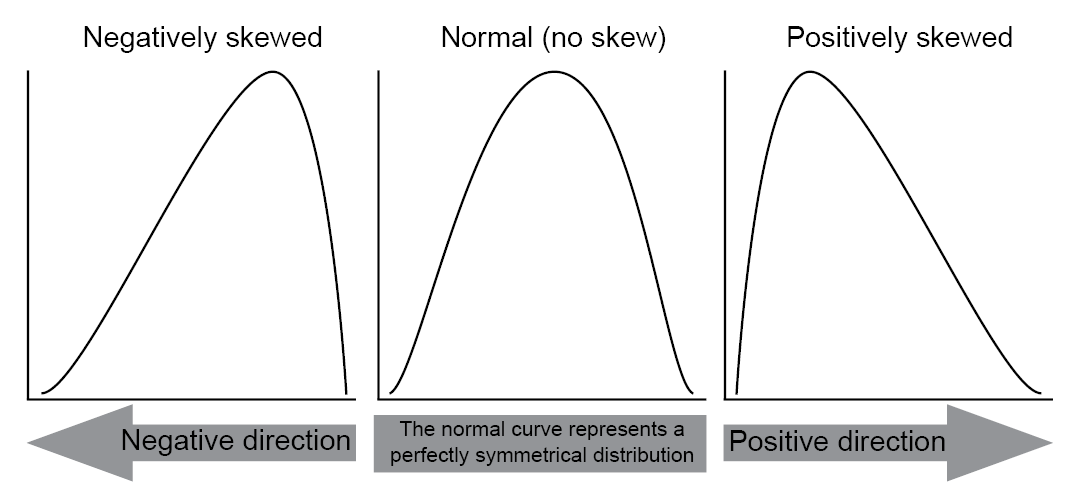
Skewed Distribution Curves
|
OCR's Distribution Curve Workbook
can be found here |


